Quantifying Cell Confluency at Scale: Parallel Plate Imaging with Automated Segmentation

Cell confluency measurement is a foundational readout in cell biology. It informs passaging decisions, treatment timing, quality control, and experimental reproducibility. In high-throughput workflows, manual review and single-field imaging approaches can introduce variability and time constraints.
All metrics reflect the experimental conditions described in our recent white paper.
This article describes a high-throughput plate-imaging workflow for automated cell confluency measurement using a 24-camera-array microscope. The approach combines parallel bright-field imaging, full z-stack acquisition, and automated cell segmentation to generate per-well confluency percentages across standard SBS plate formats.
Parallel Multi-Well Plate Imaging with a 24-Camera Array
High-throughput plate imaging traditionally relies on sequential well scanning. In contrast, the system described in the whitepaper uses 24 individual compact microscopes operating in parallel. Each camera contains a 13 megapixel digital sensor, for a combined 312 MP across the array.
This architecture enables whole-plate image acquisition with minimal lateral scanning. Under the specified conditions, tasks that typically require 15+ minutes on conventional systems are completed in tens of seconds.
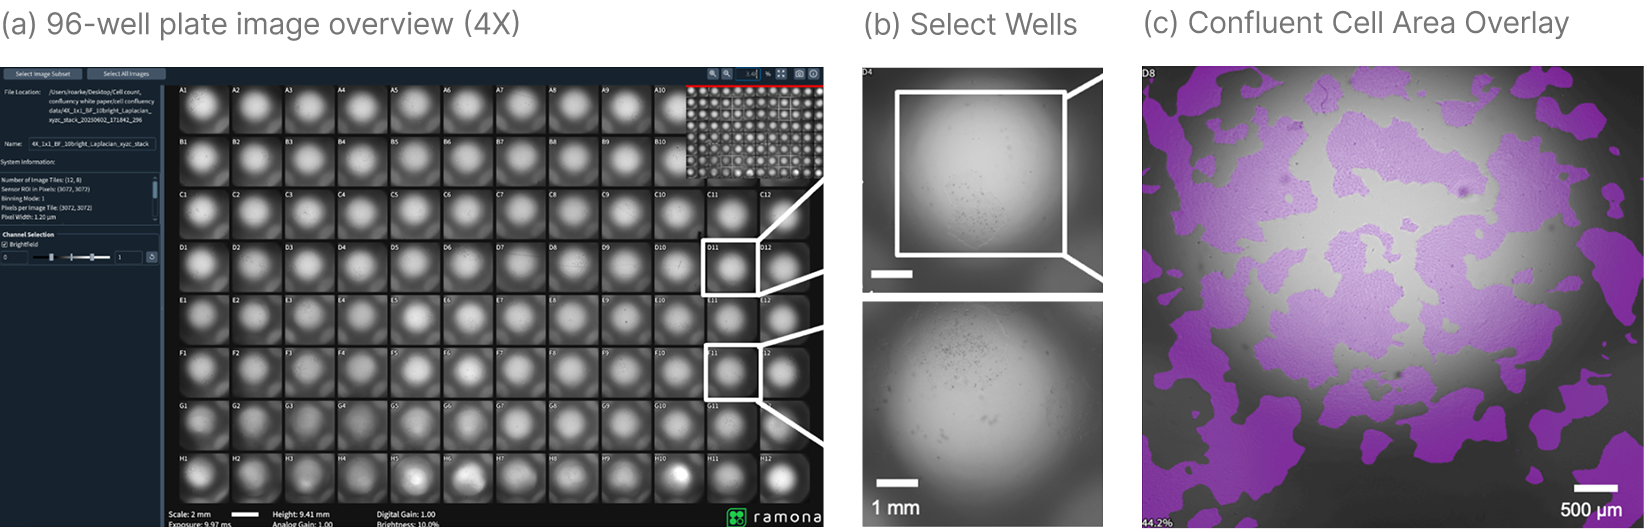
For automated cell counting and confluency analysis, bright-field imaging is used. The platform supports both 4X and 10X magnification, allowing resolution to be adjusted based on experimental requirements.
Supported plate formats include:
- 6-well plates
- 24-well plates
- 96-well plates
- 384-well plates
This makes the workflow adaptable to screening, assay development, and longitudinal monitoring studies.
96-Well Fluorescence Imaging Compatibility and Bright-Field Confluency Measurement
While confluency measurement is performed using bright-field capture, the system supports 4-channel fluorescence imaging. This enables integration with broader multi-modal workflows when required.
For live-cell screening applications, the platform includes a stage-top incubator with temperature, humidity, and CO₂/O₂ control. Time-lapse acquisition can be configured to measure confluency changes over time under controlled environmental conditions.
Full Z-Stack Acquisition for Reliable Focus Selection
A key technical feature is full z-stack acquisition at every scan location. Instead of relying solely on autofocus, the system captures complete z-stacks and applies post-processing focus identification software to select the optimal focal plane.
4X Confluency Workflow (96-Well Plate)
- 10 z-slices
- 100 µm step size
- 2×2 scan steps per well
Using this configuration, a z-stack across an entire 96-well plate is captured in 30 seconds with a 24-camera 4X system.
10X Confluency Workflow (96-Well Plate)
- 4×4 scan steps per well (3×3 optional for select plates)
- 20 z-slices
- 20-30 µm step size
Total acquisition time is 2 minutes for a 96-well plate at 10X.
This volumetric capture approach ensures that segmentation is performed on a focal plane derived from full z-stack data rather than a single autofocus decision.
Automated Cell Segmentation and Confluency Quantification
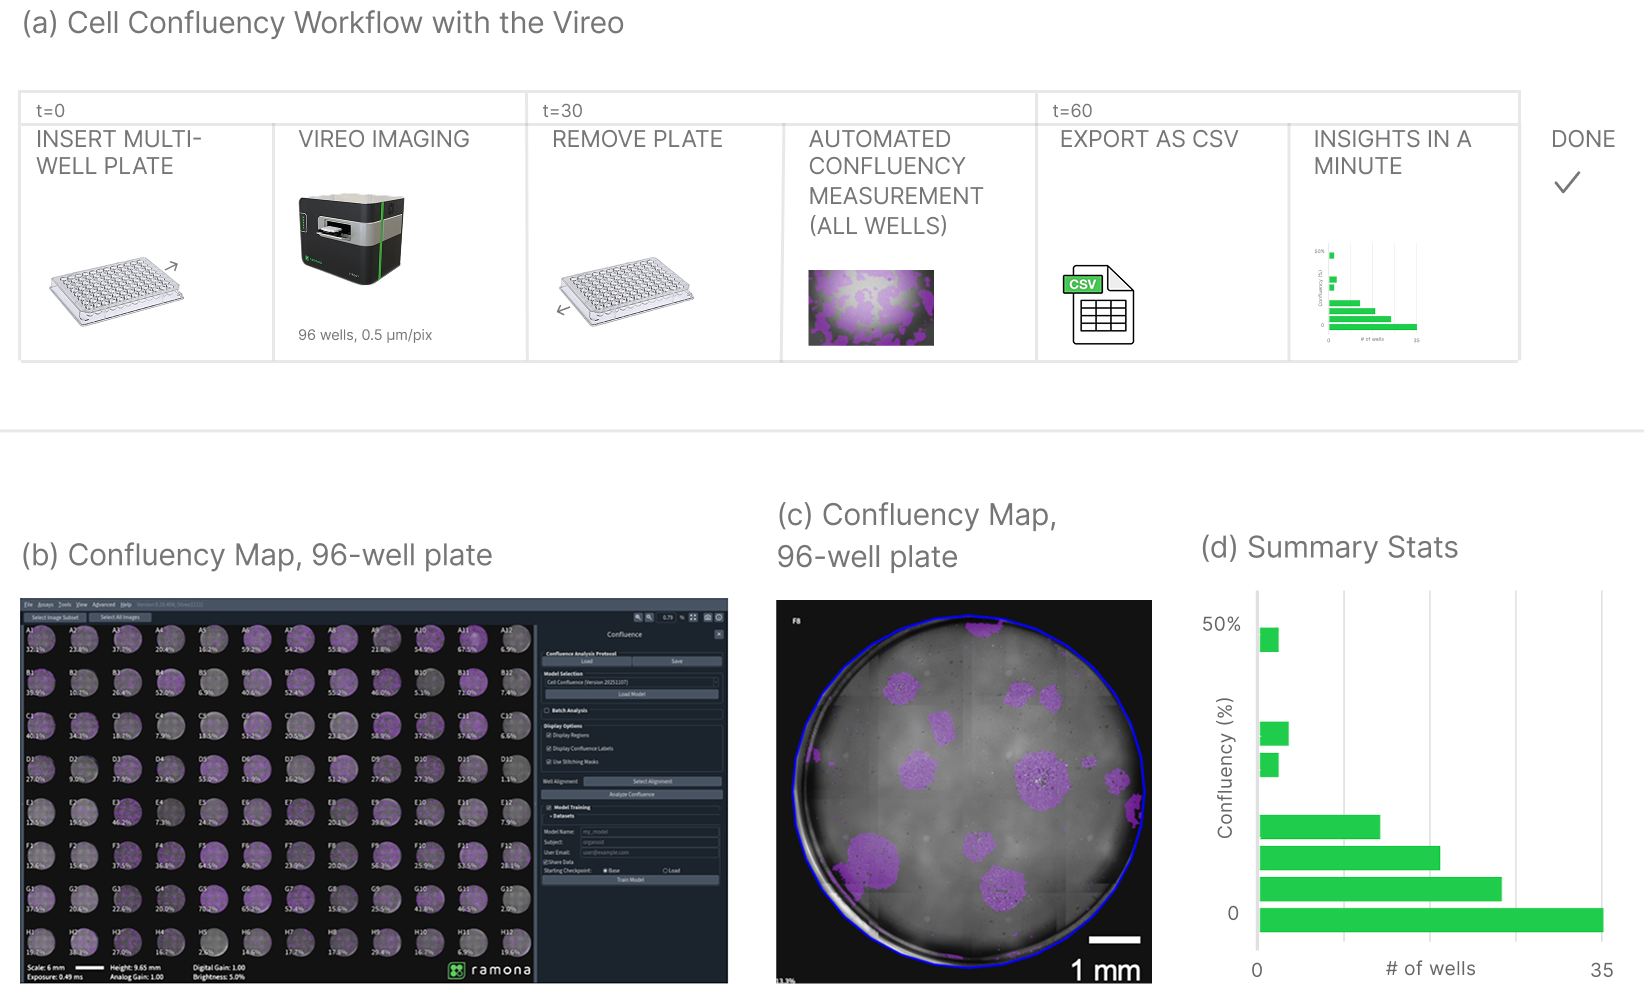
After acquisition, users select “Compute Confluence” in the software interface. A custom-developed machine learning segmentation model processes the entire plate.
The analysis produces:
- A graphical overlay of confluent regions
- A statistical report of confluency per well
Confluency is reported as a percentage of total well area. For a 96-well plate, this results in a 96-entry dataset.
Two output files are generated:
- A CSV file summarizing per-well confluency values
- An analysis_metadata.nc file containing associated metadata
These outputs support downstream statistical analysis, visualization, and integration into automated cell screening pipelines.
Managing Tiled Imaging and Overlap at 10X
At 10X magnification, multiple fields of view are required per well. A “well alignment” file accounts for tiling overlap during automated cell counting and confluency measurement.

During analysis:
- Regions outside the defined well alignment radius are excluded
- Overlapping halves of adjacent tiles are excluded
- Bottom and right overlap margins are selectively excluded
This prevents duplicated pixel counting and preserves accurate per-well area calculations in 96-well fluorescence imaging and bright-field workflows.
Alignment files can be generated within the graphical interface and reused for specific plate formats.
Application Across Plate Formats and Confluency Conditions
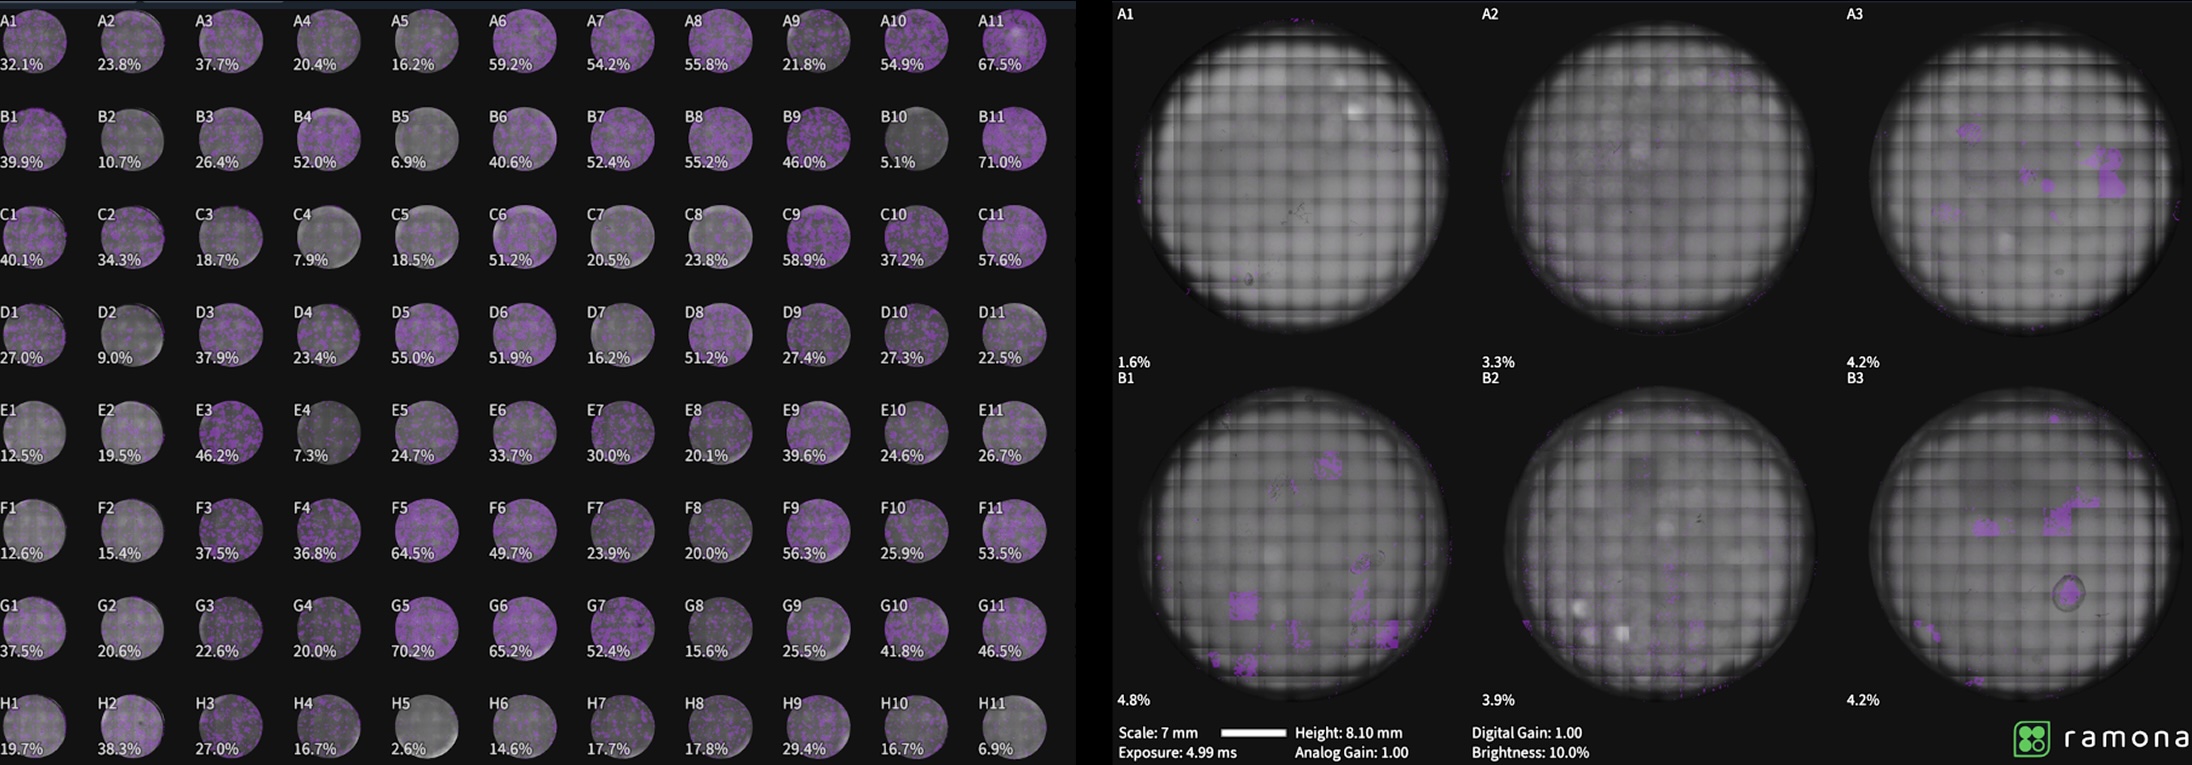
The whitepaper demonstrates the workflow using HCT116 human colorectal cancer cells in 96-well plates. The same high-throughput confluency measurement approach extends to 6-, 24-, and 384-well plates.
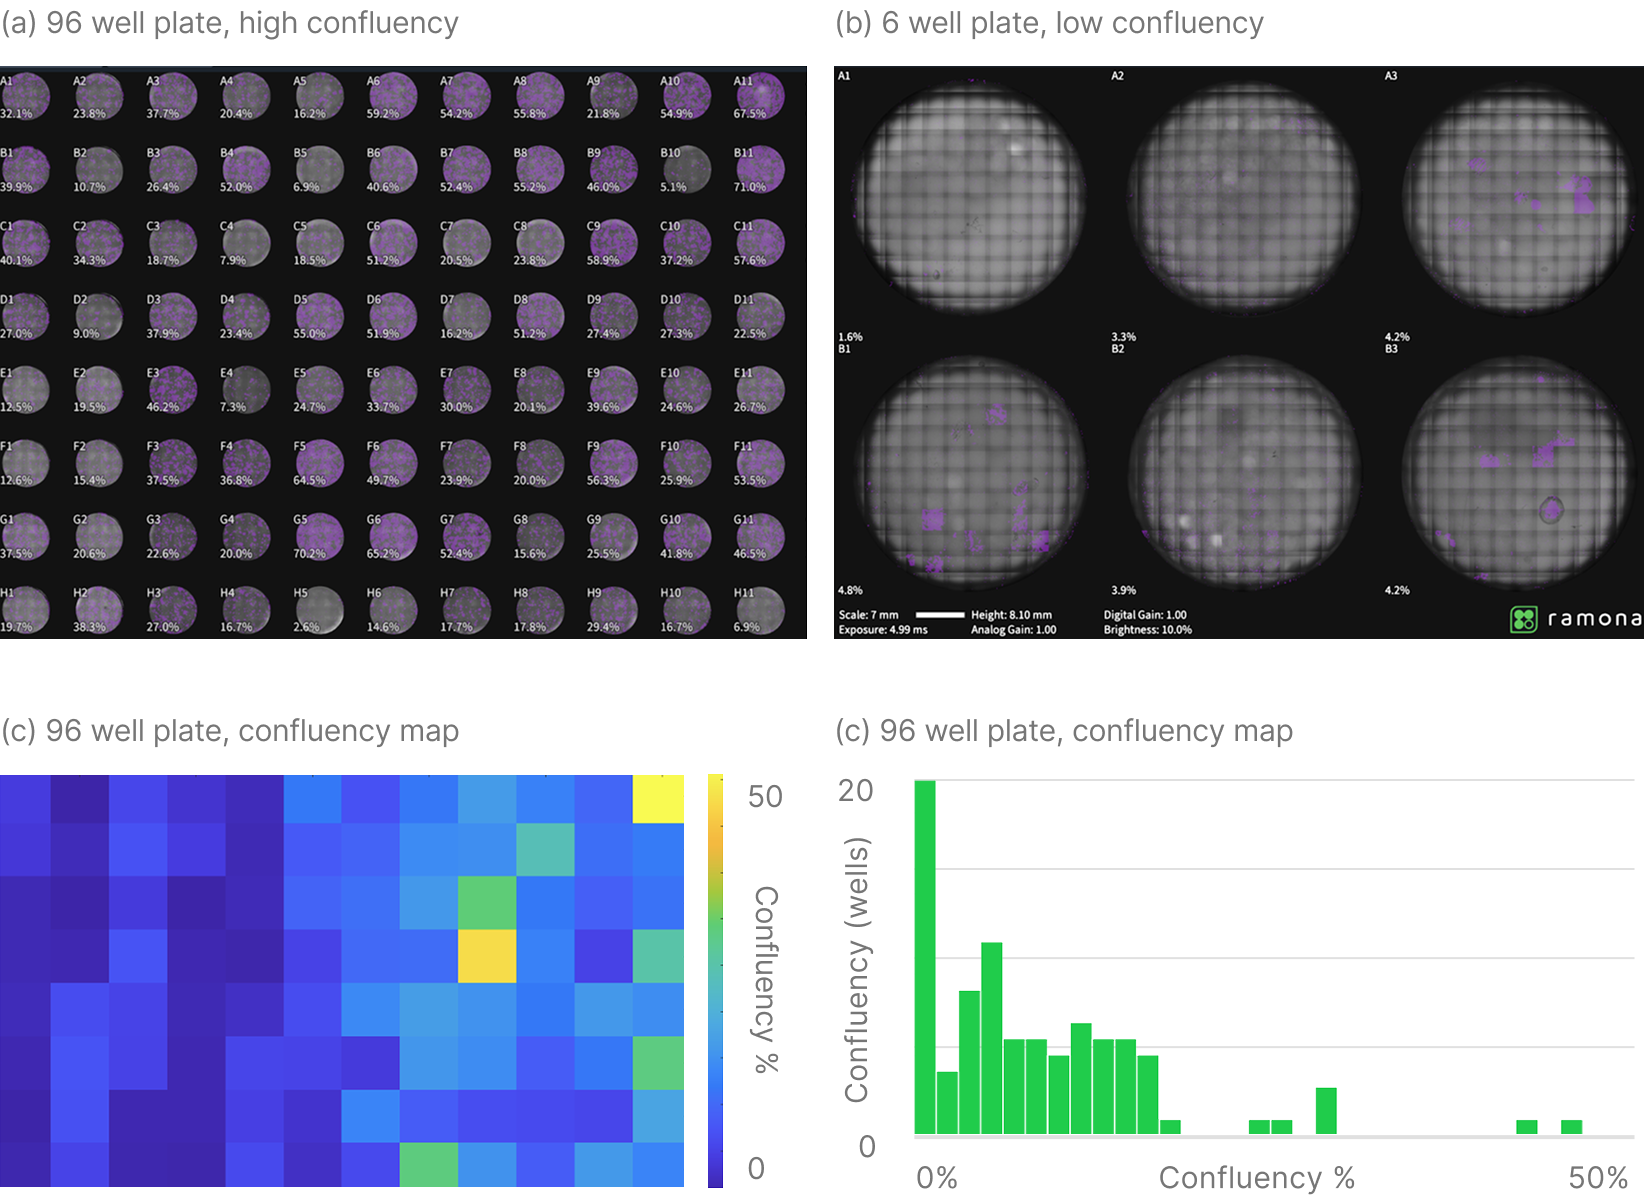
Both high- and low-confluency conditions are shown. When multiple image captures per well are required—such as in 6-well plates—the 10X alignment workflow ensures accurate area calculation.
Depending on magnification and acquisition settings, automated confluency results are available within minutes of starting the imaging experiment.
Confluency measurements described here rely on bright-field image acquisition combined with full z-stack capture and post-processing focal plane selection. At 10X magnification, well alignment files account for tile overlap and exclude duplicated regions during area calculation. Acquisition times and performance metrics correspond specifically to the configurations outlined in the January 2026 whitepaper.
Conclusion
High-throughput plate imaging requires consistency across wells, reliable focus selection, and automated analysis. The 24-camera array workflow described in the January 2026 whitepaper integrates parallel imaging, full z-stack acquisition, automated segmentation, and structured overlap correction into a unified system.
For 96-well plates, acquisition times of 30 seconds at 4X and 2 minutes at 10X are reported under the specified configurations. Confluency is quantified as percentage of well area and exported in standard data formats, supporting reproducible and scalable cell culture analysis.
Additional Reading:
High-throughput measurement of cell confluency with a multi-camera array microscope
Quantifying Cell Confluency at Scale: Parallel Plate Imaging with Automated Segmentation
Cell confluency measurement is a foundational readout in cell biology. It informs passaging decisions, treatment timing, quality control, and experimental reproducibility. In high-throughput workflows, manual review and single-field imaging approaches can introduce variability and time constraints.
All metrics reflect the experimental conditions described in our recent white paper.
This article describes a high-throughput plate-imaging workflow for automated cell confluency measurement using a 24-camera-array microscope. The approach combines parallel bright-field imaging, full z-stack acquisition, and automated cell segmentation to generate per-well confluency percentages across standard SBS plate formats.
Parallel Multi-Well Plate Imaging with a 24-Camera Array
High-throughput plate imaging traditionally relies on sequential well scanning. In contrast, the system described in the whitepaper uses 24 individual compact microscopes operating in parallel. Each camera contains a 13 megapixel digital sensor, for a combined 312 MP across the array.
This architecture enables whole-plate image acquisition with minimal lateral scanning. Under the specified conditions, tasks that typically require 15+ minutes on conventional systems are completed in tens of seconds.
For automated cell counting and confluency analysis, bright-field imaging is used. The platform supports both 4X and 10X magnification, allowing resolution to be adjusted based on experimental requirements.
Supported plate formats include:
- 6-well plates
- 24-well plates
- 96-well plates
- 384-well plates
This makes the workflow adaptable to screening, assay development, and longitudinal monitoring studies.
96-Well Fluorescence Imaging Compatibility and Bright-Field Confluency Measurement
While confluency measurement is performed using bright-field capture, the system supports 4-channel fluorescence imaging. This enables integration with broader multi-modal workflows when required.
For live-cell screening applications, the platform includes a stage-top incubator with temperature, humidity, and CO₂/O₂ control. Time-lapse acquisition can be configured to measure confluency changes over time under controlled environmental conditions.
Full Z-Stack Acquisition for Reliable Focus Selection
A key technical feature is full z-stack acquisition at every scan location. Instead of relying solely on autofocus, the system captures complete z-stacks and applies post-processing focus identification software to select the optimal focal plane.
4X Confluency Workflow (96-Well Plate)
- 10 z-slices
- 100 µm step size
- 2×2 scan steps per well
Using this configuration, a z-stack across an entire 96-well plate is captured in 30 seconds with a 24-camera 4X system.
10X Confluency Workflow (96-Well Plate)
- 4×4 scan steps per well (3×3 optional for select plates)
- 20 z-slices
- 20-30 µm step size
Total acquisition time is 2 minutes for a 96-well plate at 10X.
This volumetric capture approach ensures that segmentation is performed on a focal plane derived from full z-stack data rather than a single autofocus decision.
Automated Cell Segmentation and Confluency Quantification
After acquisition, users select “Compute Confluence” in the software interface. A custom-developed machine learning segmentation model processes the entire plate.
The analysis produces:
- A graphical overlay of confluent regions
- A statistical report of confluency per well
Confluency is reported as a percentage of total well area. For a 96-well plate, this results in a 96-entry dataset.
Two output files are generated:
- A CSV file summarizing per-well confluency values
- An analysis_metadata.nc file containing associated metadata
These outputs support downstream statistical analysis, visualization, and integration into automated cell screening pipelines.
Managing Tiled Imaging and Overlap at 10X
At 10X magnification, multiple fields of view are required per well. A “well alignment” file accounts for tiling overlap during automated cell counting and confluency measurement.
During analysis:
- Regions outside the defined well alignment radius are excluded
- Overlapping halves of adjacent tiles are excluded
- Bottom and right overlap margins are selectively excluded
This prevents duplicated pixel counting and preserves accurate per-well area calculations in 96-well fluorescence imaging and bright-field workflows.
Alignment files can be generated within the graphical interface and reused for specific plate formats.
Application Across Plate Formats and Confluency Conditions
The whitepaper demonstrates the workflow using HCT116 human colorectal cancer cells in 96-well plates. The same high-throughput confluency measurement approach extends to 6-, 24-, and 384-well plates.
Both high- and low-confluency conditions are shown. When multiple image captures per well are required—such as in 6-well plates—the 10X alignment workflow ensures accurate area calculation.
Depending on magnification and acquisition settings, automated confluency results are available within minutes of starting the imaging experiment.
Confluency measurements described here rely on bright-field image acquisition combined with full z-stack capture and post-processing focal plane selection. At 10X magnification, well alignment files account for tile overlap and exclude duplicated regions during area calculation. Acquisition times and performance metrics correspond specifically to the configurations outlined in the January 2026 whitepaper.
Conclusion
High-throughput plate imaging requires consistency across wells, reliable focus selection, and automated analysis. The 24-camera array workflow described in the January 2026 whitepaper integrates parallel imaging, full z-stack acquisition, automated segmentation, and structured overlap correction into a unified system.
For 96-well plates, acquisition times of 30 seconds at 4X and 2 minutes at 10X are reported under the specified configurations. Confluency is quantified as percentage of well area and exported in standard data formats, supporting reproducible and scalable cell culture analysis.
Additional Reading:
High-throughput measurement of cell confluency with a multi-camera array microscope
Speakers
Quantifying Cell Confluency at Scale: Parallel Plate Imaging with Automated Segmentation
Scaling biological insight: Vireo for 4D imaging
