Scaling biological insight: Vireo for 4D imaging

Introduction
Fluorescence imaging is a crucial tool in biology as it enables real-time visualization of dynamic processes in cell cultures, tissues, or organisms with high specificity and sensitivity. This imaging modality gives researchers information of a wide range of biological activities both at the cellular and intracellular levels such as cell migration and interactions, cell division, and protein interactions in real time.
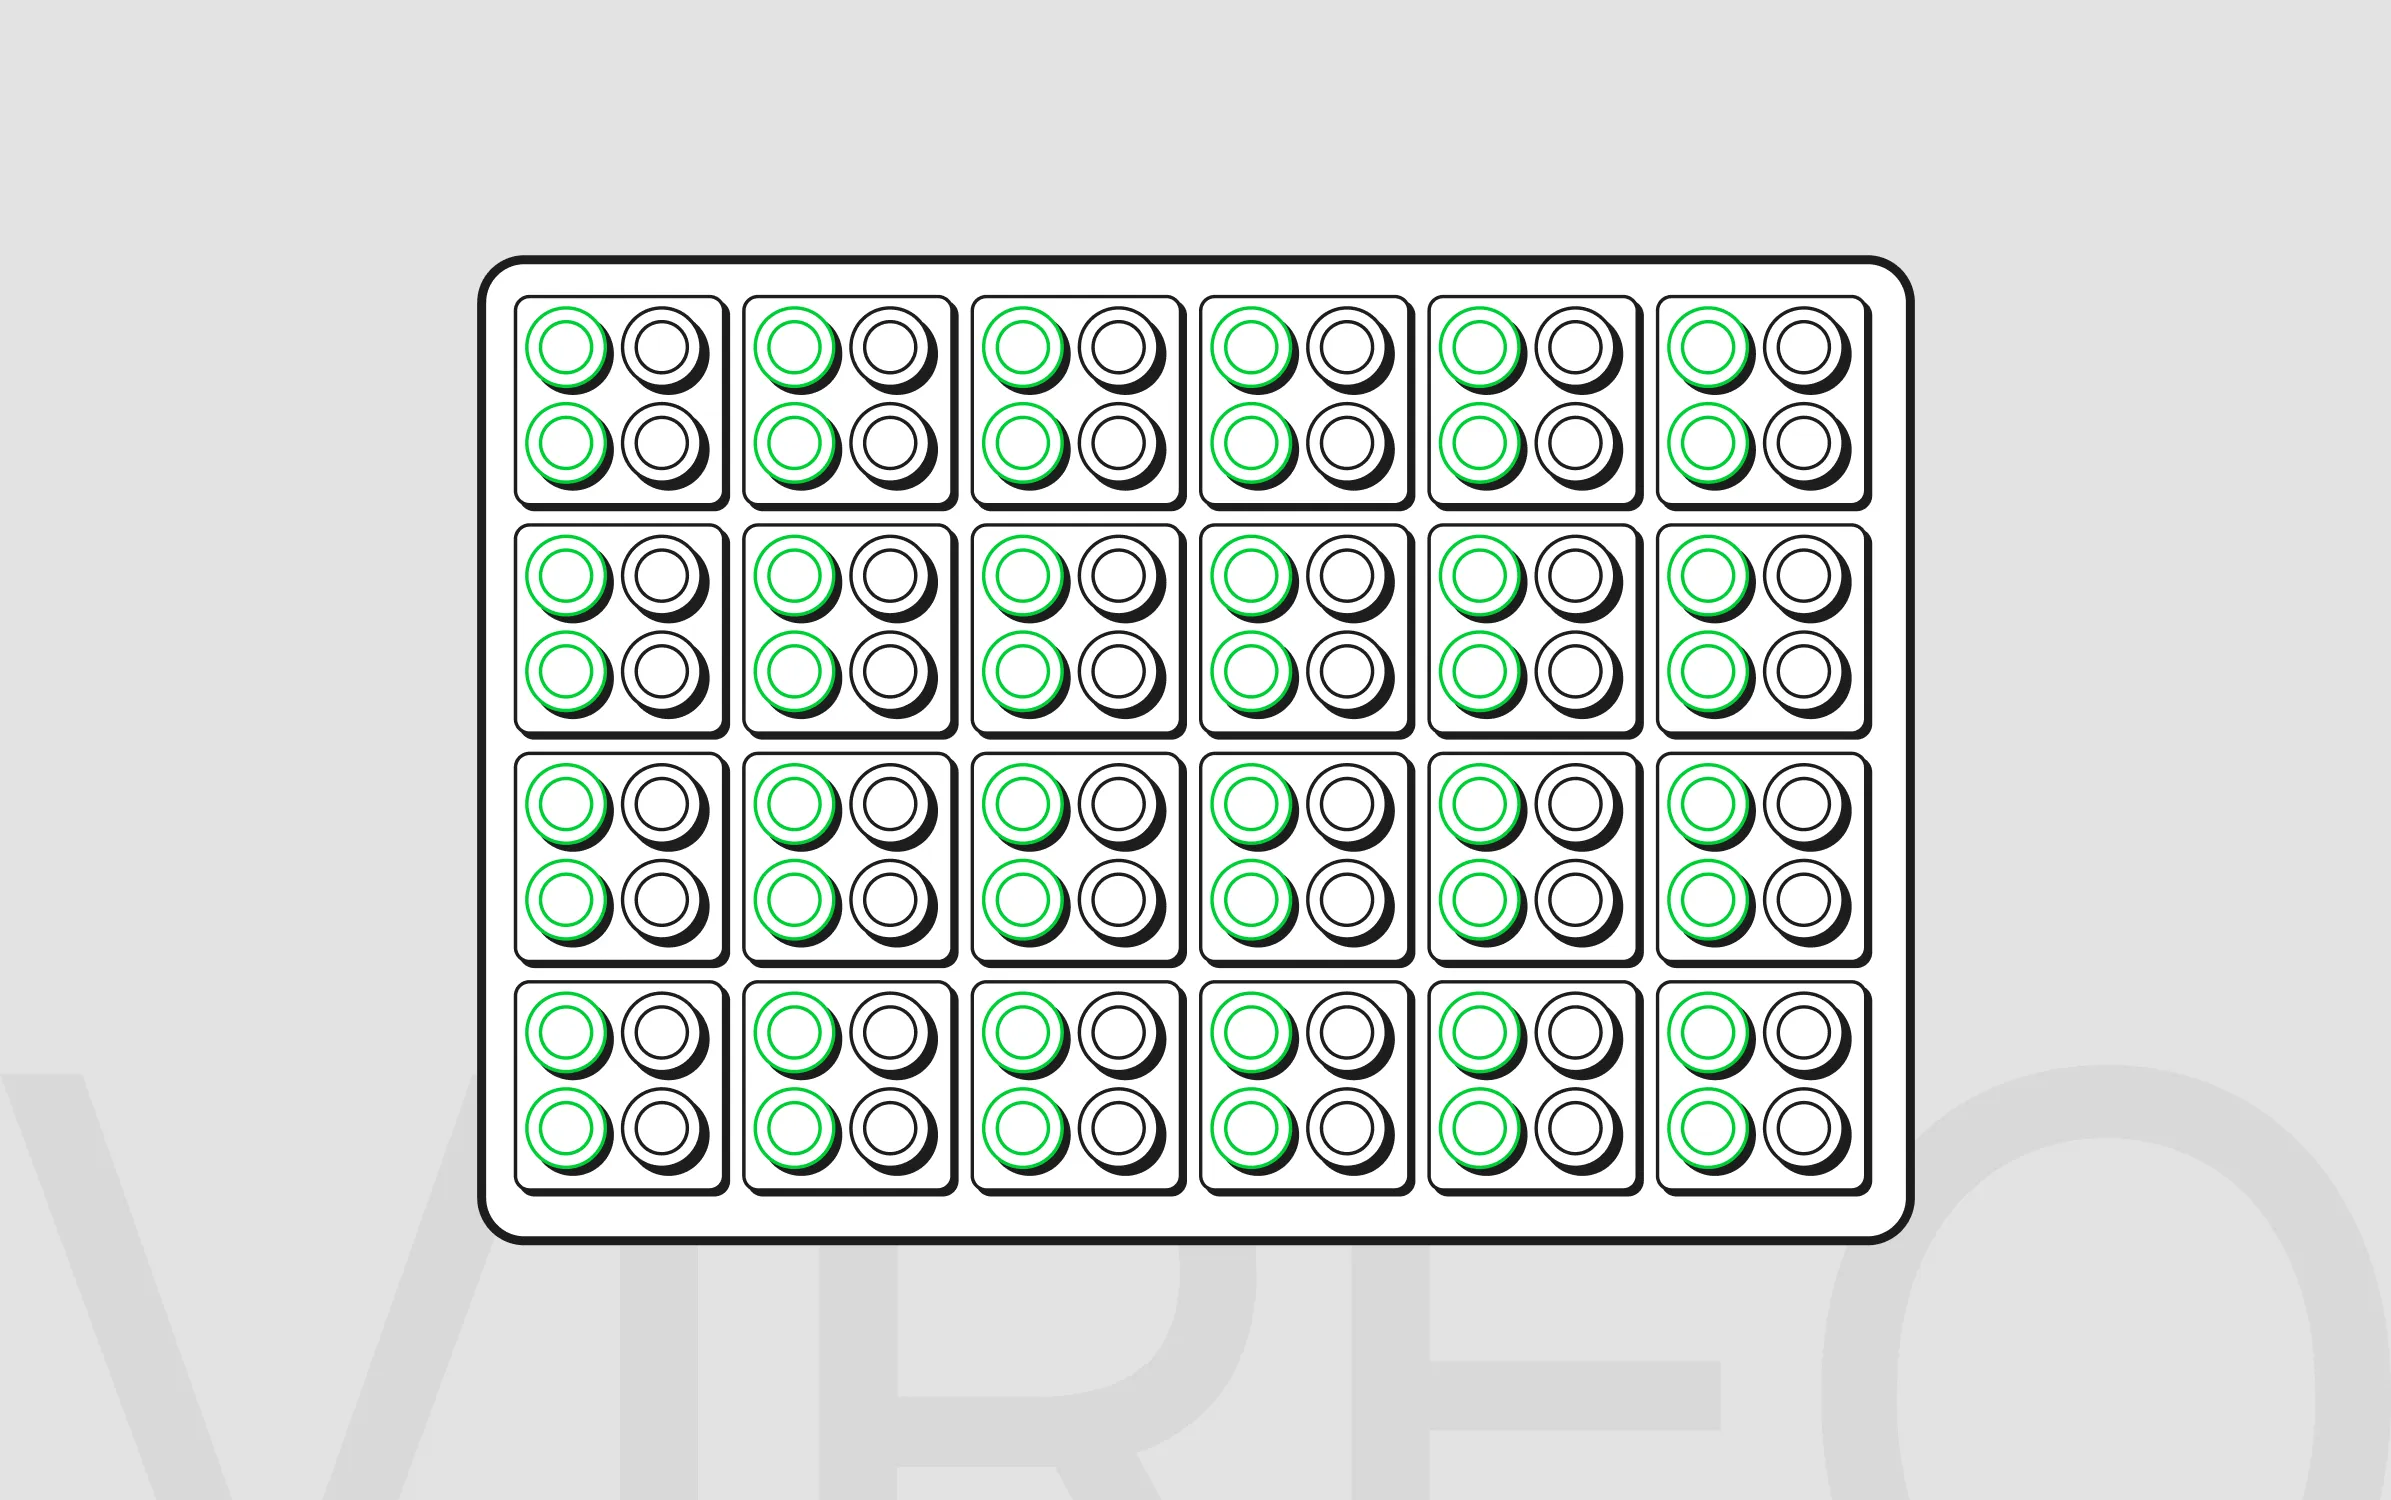
Increasing the throughput of fluorescence imaging has been challenging in traditional microscope designs with a single objective. The use of single-objective fluorescence microscopes to image a large number of wells is labor-intensive and can lead to suboptimal results due to the time needed in the image acquisition across wells, photobleaching, and decreased cell viability through the imaging process in non-incubated systems. The Vireo™ imaging system (“Vireo”) using Ramona Optics’ Multi-Camera Array Microscope (MCAM®) technology has been designed to overcome all these hurdles. The Vireo includes 24 objectives organized in a compact array, allowing the imaging of a multiwell plate using up to four fluorescent channels (Blue, Green, Red, Far Red) with 10 Z-steps in approximately 20 minutes (depending on the type of plate, number of fluorescence channels used and exposure times) compared to other systems that take hours for equivalent imaging experiments. As all the wells in the plate are imaged simultaneously, this system reduces variability of time-sensitive experiments.

Here, we outline several image analysis workflows that can be used to process and extract useful biologically-relevant information from data captured on the Vireo by Ramona Optics. Specifically, we focus on flattening Z-stacks (projection), distance measurement between cells, and timelapse imaging. While these workflows can be adapted to other fluorescence imaging datasets, they are optimized for, and uniquely enhanced by the Vireo's architecture. Its ability to simultaneously capture high-resolution, multi-channel, and multi-plane images across entire well plates makes it the ideal platform for streamlined, scalable analysis of complex biological systems.
Projection
Acquiring in-focus images of diverse biological samples, particularly multi-cellular, three-dimensional structures like organoids, necessitates Z-stacks or XYZ-stacks to capture multiple focal planes. Image projections enable simpler analysis by flattening these Z-stacks that represent 3D data into one 2D image, often called a Z-projection. Maximum intensity projection (MIP or max projection) is common for fluorescence imaging, selecting the brightest pixel value across Z-planes to create an image with the most in-focus and robust signals. For brightfield imaging, minimum intensity projection is preferred, selecting the darkest pixel values as these images have inverted information compared to fluorescent images.
These stack projections can be performed directly in the MCAM software either during your acquisition or as a post-acquisition step (Figure 2).

Figure 2. Use of the Vireo’s integrated data viewer (“MCAM Viewer”) to generate projections from imaging data. Representative data opened using the MCAM Viewer software depicting cells stained with a far-red (Excitation: 633 nm) fluorescent label with multiple Z-planes represented in the dataset. Menu selections highlighted in blue on the left side of the image indicate the two simple selections needed to open the Stack Projection panel depicted in the right side of the image. The Stack Projection panel depicted in the right side of the image is then used to select the file directory, output file type, projection type including minimum, maximum, mean, laplacian, and standard deviation options, which Z-planes are to be included in the projection, and finally whether the projection is to be applied to all images or a subset of images.

Measuring distance
Several experimental questions focus on understanding the localization of one cell type relative to another. In immunology, for example, immune cell activity and homing to cancer cells can be assessed by quantifying immune cell distance from the cancer cells, the degree of immune cell clustering around cancer cells, and the interaction dynamics that take place in these co-cultures. Similarly, studies measuring the migration of cancer cells through engineered microenvironments can help us understand the metastatic potential of cancer cells under altered environmental contexts and treatment conditions.
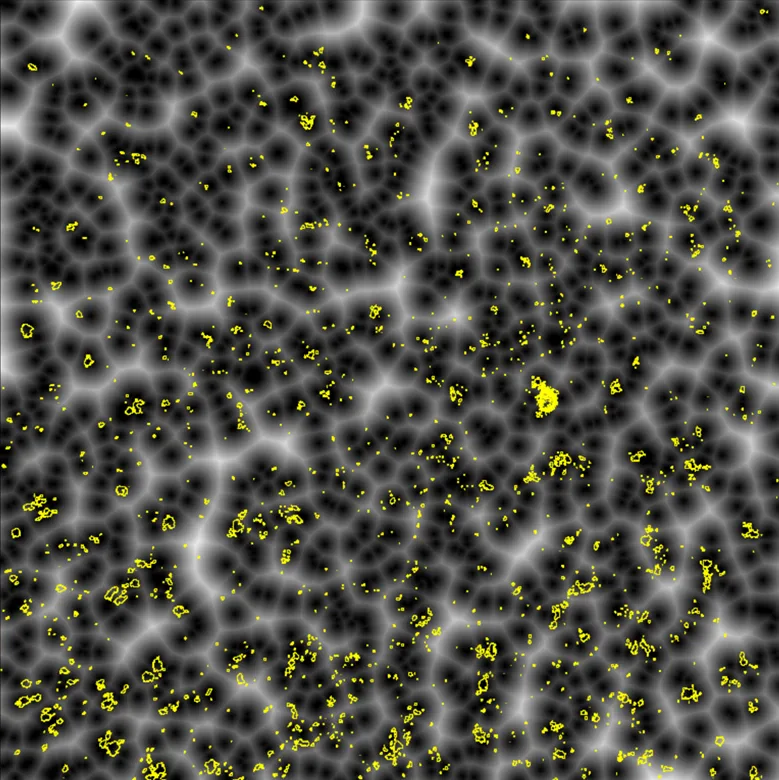
Quantifying distances between fluorescently labeled cells can be accomplished using a technique called Euclidean distance mapping. Rather than rely on manual distance measurements or subjective scoring, this method uses a simple algorithm to transform a thresholded (binary) mask of one fluorescent channel into an image in which increasing pixel values represent distance from the nearest object, as depicted in Figure 3. By overlaying the resulting Euclidean distance map derived from images captured in the first fluorescent channel with the thresholded result of the second fluorescent channel, researchers can automatically extract precise distance measurements between any two labeled objects across the entire field of view. Based on the known pixel size of an image, the pixel intensity values in the Euclidean distance map correspond to the minimum distance from each object in the second fluorescent channel to the nearest object in the first fluorescent channel. An additional advantage of this method is that all possible distances between objects are captured. Using ImageJ, for example, we can overlay the results of segmented objects in the second channel over the distance map with simple “Analyze Particles” functions included in ImageJ to return the mean intensity values of the pixels within each object. This corresponds to the average distance of these objects in the second channel from the first.

Timelapse
Analyzing the distance between objects over time allows us to understand the migration or interaction dynamics of cell populations in different conditions. After constructing multi-channel time series image sets, several analysis approaches allow for a robust assessment of changes in migratory patterns in terms of speed and directionality. Using the incubation features of the Vireo, we can perform the aforementioned fluorescent imaging at different timepoints, for example, imaging every hour for 8 hours. This will provide us with eight image datasets that can be stitched, projected, and channel merged. To add the timelapse effect, we create another Tiff stack in which each frame no longer indicates a plane but corresponds to a projected ? image from a single timepoint, thus enabling us to visualize the dynamics of cells or molecules across time within a single image file. Further downstream analysis allows us to characterize cell movements and cell associations and even follow dynamic events at the single-cell level.
Conclusion
Taken together, the integrated MCAM analysis tools and secondary analysis workflows discussed here provide the components to detangle the dynamic, multi-channel, multi-timepoint, and multi-sample imaging data the Vireo is capable of acquiring. Rapid, easy distillation of complex data into interpretable forms accelerates the user’s ability to ask biological questions and get imaging-based answers. As individualized medicine and drug screening efforts advance, fast image acquisition and analysis will become even more crucial to provide timely and reliable results that may help guide treatment decisions in the clinical setting.
ACKNOWLEGMENTS: The Ramona team would like to express their gratitude to Nicholas Edenhoffer and Gemma Nomdedéu Sancho, both Ph.D. candidates at Wake Forest University School of Medicine, for their contributions in evaluating our Vireo product and drafting this article.
Introduction
Fluorescence imaging is a crucial tool in biology as it enables real-time visualization of dynamic processes in cell cultures, tissues, or organisms with high specificity and sensitivity. This imaging modality gives researchers information of a wide range of biological activities both at the cellular and intracellular levels such as cell migration and interactions, cell division, and protein interactions in real time.
Increasing the throughput of fluorescence imaging has been challenging in traditional microscope designs with a single objective. The use of single-objective fluorescence microscopes to image a large number of wells is labor-intensive and can lead to suboptimal results due to the time needed in the image acquisition across wells, photobleaching, and decreased cell viability through the imaging process in non-incubated systems. The Vireo™ imaging system (“Vireo”) using Ramona Optics’ Multi-Camera Array Microscope (MCAM®) technology has been designed to overcome all these hurdles. The Vireo includes 24 objectives organized in a compact array, allowing the imaging of a multiwell plate using up to four fluorescent channels (Blue, Green, Red, Far Red) with 10 Z-steps in approximately 20 minutes (depending on the type of plate, number of fluorescence channels used and exposure times) compared to other systems that take hours for equivalent imaging experiments. As all the wells in the plate are imaged simultaneously, this system reduces variability of time-sensitive experiments.
Here, we outline several image analysis workflows that can be used to process and extract useful biologically-relevant information from data captured on the Vireo by Ramona Optics. Specifically, we focus on flattening Z-stacks (projection), distance measurement between cells, and timelapse imaging. While these workflows can be adapted to other fluorescence imaging datasets, they are optimized for, and uniquely enhanced by the Vireo's architecture. Its ability to simultaneously capture high-resolution, multi-channel, and multi-plane images across entire well plates makes it the ideal platform for streamlined, scalable analysis of complex biological systems.
Projection
Acquiring in-focus images of diverse biological samples, particularly multi-cellular, three-dimensional structures like organoids, necessitates Z-stacks or XYZ-stacks to capture multiple focal planes. Image projections enable simpler analysis by flattening these Z-stacks that represent 3D data into one 2D image, often called a Z-projection. Maximum intensity projection (MIP or max projection) is common for fluorescence imaging, selecting the brightest pixel value across Z-planes to create an image with the most in-focus and robust signals. For brightfield imaging, minimum intensity projection is preferred, selecting the darkest pixel values as these images have inverted information compared to fluorescent images.
These stack projections can be performed directly in the MCAM software either during your acquisition or as a post-acquisition step (Figure 2).
Figure 2. Use of the Vireo’s integrated data viewer (“MCAM Viewer”) to generate projections from imaging data. Representative data opened using the MCAM Viewer software depicting cells stained with a far-red (Excitation: 633 nm) fluorescent label with multiple Z-planes represented in the dataset. Menu selections highlighted in blue on the left side of the image indicate the two simple selections needed to open the Stack Projection panel depicted in the right side of the image. The Stack Projection panel depicted in the right side of the image is then used to select the file directory, output file type, projection type including minimum, maximum, mean, laplacian, and standard deviation options, which Z-planes are to be included in the projection, and finally whether the projection is to be applied to all images or a subset of images.
Measuring distance
Several experimental questions focus on understanding the localization of one cell type relative to another. In immunology, for example, immune cell activity and homing to cancer cells can be assessed by quantifying immune cell distance from the cancer cells, the degree of immune cell clustering around cancer cells, and the interaction dynamics that take place in these co-cultures. Similarly, studies measuring the migration of cancer cells through engineered microenvironments can help us understand the metastatic potential of cancer cells under altered environmental contexts and treatment conditions.
Quantifying distances between fluorescently labeled cells can be accomplished using a technique called Euclidean distance mapping. Rather than rely on manual distance measurements or subjective scoring, this method uses a simple algorithm to transform a thresholded (binary) mask of one fluorescent channel into an image in which increasing pixel values represent distance from the nearest object, as depicted in Figure 3. By overlaying the resulting Euclidean distance map derived from images captured in the first fluorescent channel with the thresholded result of the second fluorescent channel, researchers can automatically extract precise distance measurements between any two labeled objects across the entire field of view. Based on the known pixel size of an image, the pixel intensity values in the Euclidean distance map correspond to the minimum distance from each object in the second fluorescent channel to the nearest object in the first fluorescent channel. An additional advantage of this method is that all possible distances between objects are captured. Using ImageJ, for example, we can overlay the results of segmented objects in the second channel over the distance map with simple “Analyze Particles” functions included in ImageJ to return the mean intensity values of the pixels within each object. This corresponds to the average distance of these objects in the second channel from the first.
Timelapse
Analyzing the distance between objects over time allows us to understand the migration or interaction dynamics of cell populations in different conditions. After constructing multi-channel time series image sets, several analysis approaches allow for a robust assessment of changes in migratory patterns in terms of speed and directionality. Using the incubation features of the Vireo, we can perform the aforementioned fluorescent imaging at different timepoints, for example, imaging every hour for 8 hours. This will provide us with eight image datasets that can be stitched, projected, and channel merged. To add the timelapse effect, we create another Tiff stack in which each frame no longer indicates a plane but corresponds to a projected ? image from a single timepoint, thus enabling us to visualize the dynamics of cells or molecules across time within a single image file. Further downstream analysis allows us to characterize cell movements and cell associations and even follow dynamic events at the single-cell level.
Conclusion
Taken together, the integrated MCAM analysis tools and secondary analysis workflows discussed here provide the components to detangle the dynamic, multi-channel, multi-timepoint, and multi-sample imaging data the Vireo is capable of acquiring. Rapid, easy distillation of complex data into interpretable forms accelerates the user’s ability to ask biological questions and get imaging-based answers. As individualized medicine and drug screening efforts advance, fast image acquisition and analysis will become even more crucial to provide timely and reliable results that may help guide treatment decisions in the clinical setting.
ACKNOWLEGMENTS: The Ramona team would like to express their gratitude to Nicholas Edenhoffer and Gemma Nomdedéu Sancho, both Ph.D. candidates at Wake Forest University School of Medicine, for their contributions in evaluating our Vireo product and drafting this article.
Speakers
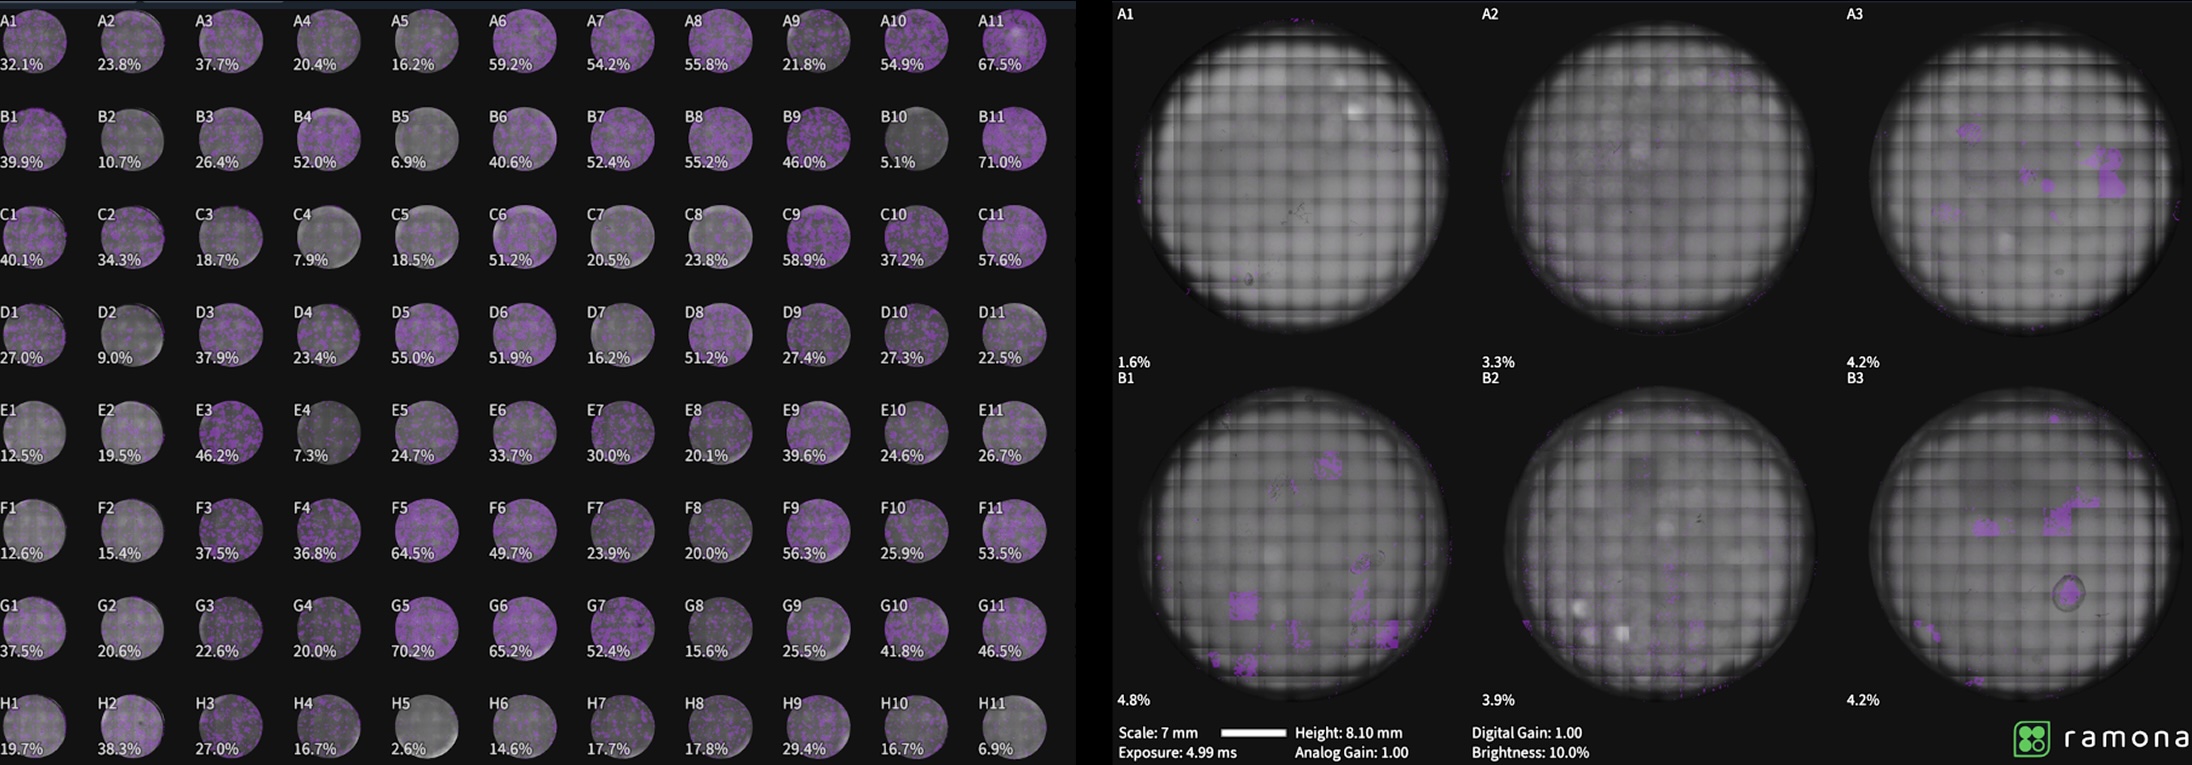
Quantifying Cell Confluency at Scale: Parallel Plate Imaging with Automated Segmentation
Scaling biological insight: Vireo for 4D imaging
